Call Tracker
See what makes your phone ring.
Every call tied back to the campaign, keyword, and ad that drove it. Call recording, SMS, and real time reporting included.
Unlimited users. No contracts.
Introducing Calls by Time of Day: See Exactly When Your Phone Rings

You already know how many calls each campaign produced. What you probably do not know is when they arrived. Half of them might land between 11am and 2pm, and Saturday morning might be quietly busier than Friday afternoon. Whoever is rostered in those hours, and whoever is not, decides how many of those calls get answered.
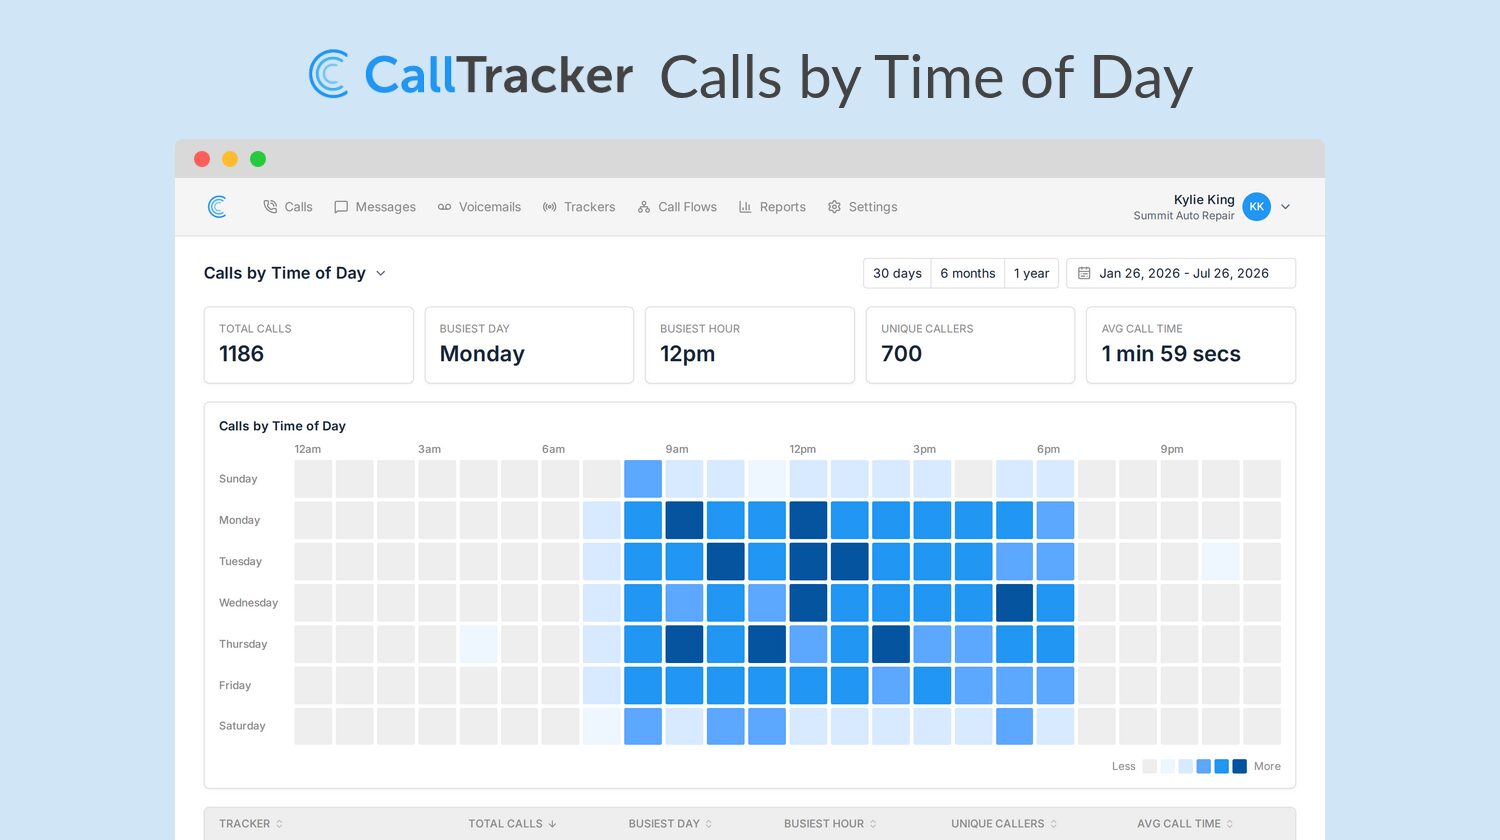
Today we’re adding Calls by Time of Day to your reports. It lays every call out on a grid of weekday by hour, shaded by volume, so the pattern shows up without you reading a single number.
What Calls by Time of Day Shows You
- A grid of all seven weekdays across all 24 hours, shaded from quiet to busy.
- Your busiest day and busiest hour, as headline figures at the top of the page.
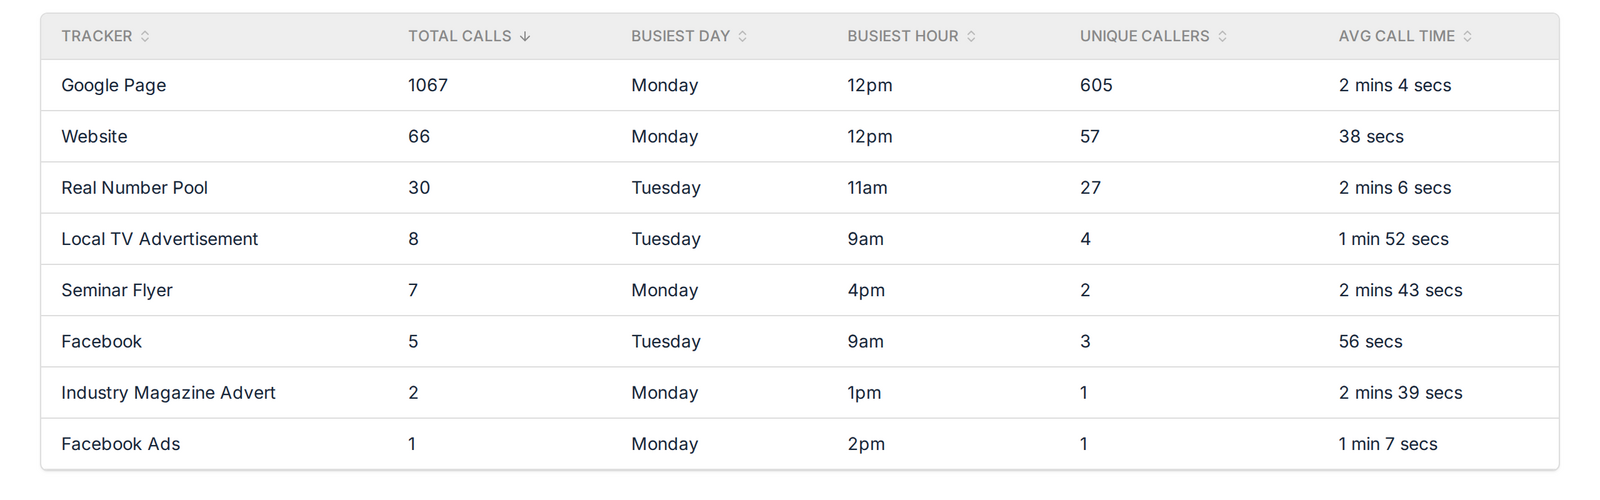
- The same busiest day and busiest hour broken out for every tracking number you run.
- Total calls, unique callers, and average call time for the period you selected.
- Any date range you like: the last 30 days, six months, a year, or a custom window.
Your Whole Week On One Screen
Seven rows, one per weekday. Twenty four columns, one per hour. Every square is shaded by how many calls arrived in that slot, and hovering one gives you the exact count.
Most call reports give you a total and leave the timing to your imagination. This one puts the whole week on screen at once, so the block of color where your business actually happens is the first thing you see. The empty squares are worth as much as the full ones. If Sunday is blank and Saturday is not, that is a staffing decision you can make today.
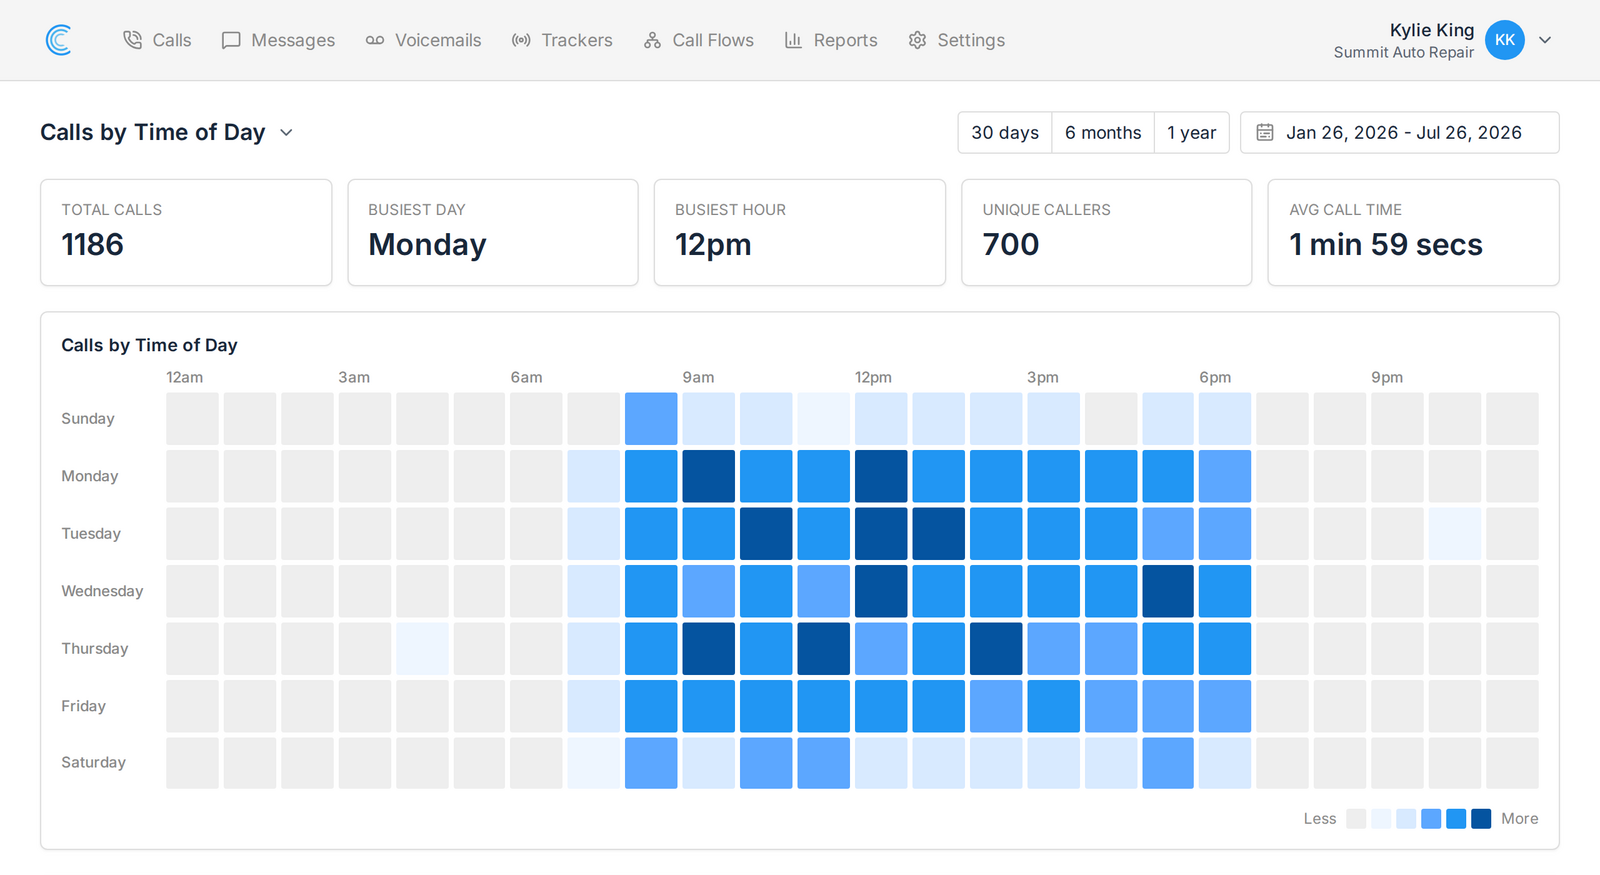
The shading ranks each hour against your other busy hours rather than scaling everything against your single busiest slot. We tried it the other way first. On a real account with a huge Monday morning, a linear scale pushed 84 of 130 busy hours into the same pale step and the grid came out nearly flat. Ranking spreads the range out, which is the only reason to color the grid at all.
Every Tracking Number Peaks At A Different Time
Underneath the grid sits a table with one row per tracker: total calls, busiest day, busiest hour, unique callers, and average call time.
Your Google Ads number and your direct mail number almost never peak at the same time. A radio spot spikes in the hour after it airs. A billboard picks up the commute. Add them all together and the grid shows you an average that belongs to none of them, which is what the table is for.
What To Do With The Pattern
- Staff your peak. If Tuesday at 12pm is your busiest hour, that is the hour you cannot have one person at lunch and the other stuck on another line.
- Set your Google Ads schedule against the hours that actually produce calls rather than the hours you assume they do.
- Give the early and late calls somewhere to go, with a call flow or with voicemail and transcription.
- Look hard at Saturday. Plenty of service businesses find real weekend demand and nobody scheduled to answer it.
- Send the email, run the spot, or push the promotion into the window your phone already rings in.
Counted In Your Timezone, Not Ours
An hourly report is worthless if the hours are wrong. The grid and the table both group calls using the timezone set on your company, so 9am means 9am where you are, and the report follows your daylight saving changes. If you run companies in several timezones, each one reports in its own.
Calls marked as spam are left out, so a run of junk calls at 3am does not turn into a peak you have to explain to a client.
Better Headline Numbers On Every Call Report
While building this we put a row of headline figures on every other report too. Calls by Tracker opens with answered and missed alongside the total. Calls by Source Channel and Calls by Keyword name your top channel and top keyword, and how many of each you are getting calls from. Calls by Tag counts your tagged calls and your most used tag. Calls by Value shows total and average value. Both message reports lead with total messages and conversations.
It is a small change that saves the arithmetic you were doing in your head every time you opened a report.
Where To Find It
Open Reports and pick Calls by Time of Day from the report menu. It is there now for every company on every plan, and there is nothing to switch on.
If you manage several clients, the report sits inside each company’s own reporting, so it carries your branding on white label accounts and stays separated across multiple companies like everything else.
Have a look at your own numbers and see whether the week runs the way you think it does. Not using Call Tracker yet? Start your 14 day free trial and find out which campaigns make your phone ring, and when. Questions are welcome at support@calltracker.io or in our help docs.
Keep reading
Marketing
How to Track Missed Calls and Follow Up
Roughly one call in six goes unanswered, and each one was a lead you already paid for. Here is how to find ...

Marketing
Call Tracking That Works With Your Existing Phone System
You do not replace your phones, your carrier, or your number to start tracking calls. A tracking number sit...

Marketing
CallRail Pricing in 2026: Plans, Overages, and What You Actually Pay
CallRail pricing starts at $50 a month, but every plan includes the same 5 numbers and 250 minutes. Here is...