See which campaigns make your phone ring
See which campaigns, keywords and channels produce calls, so your budget goes to the marketing that works.
Spend your budget where the calls come from
Fund what works
See which campaigns make the phone ring and move budget to them.
Bid on the right keywords
Know which search terms produce calls, not only clicks.
Catch trends early
Compare incoming calls with your marketing as the data arrives.
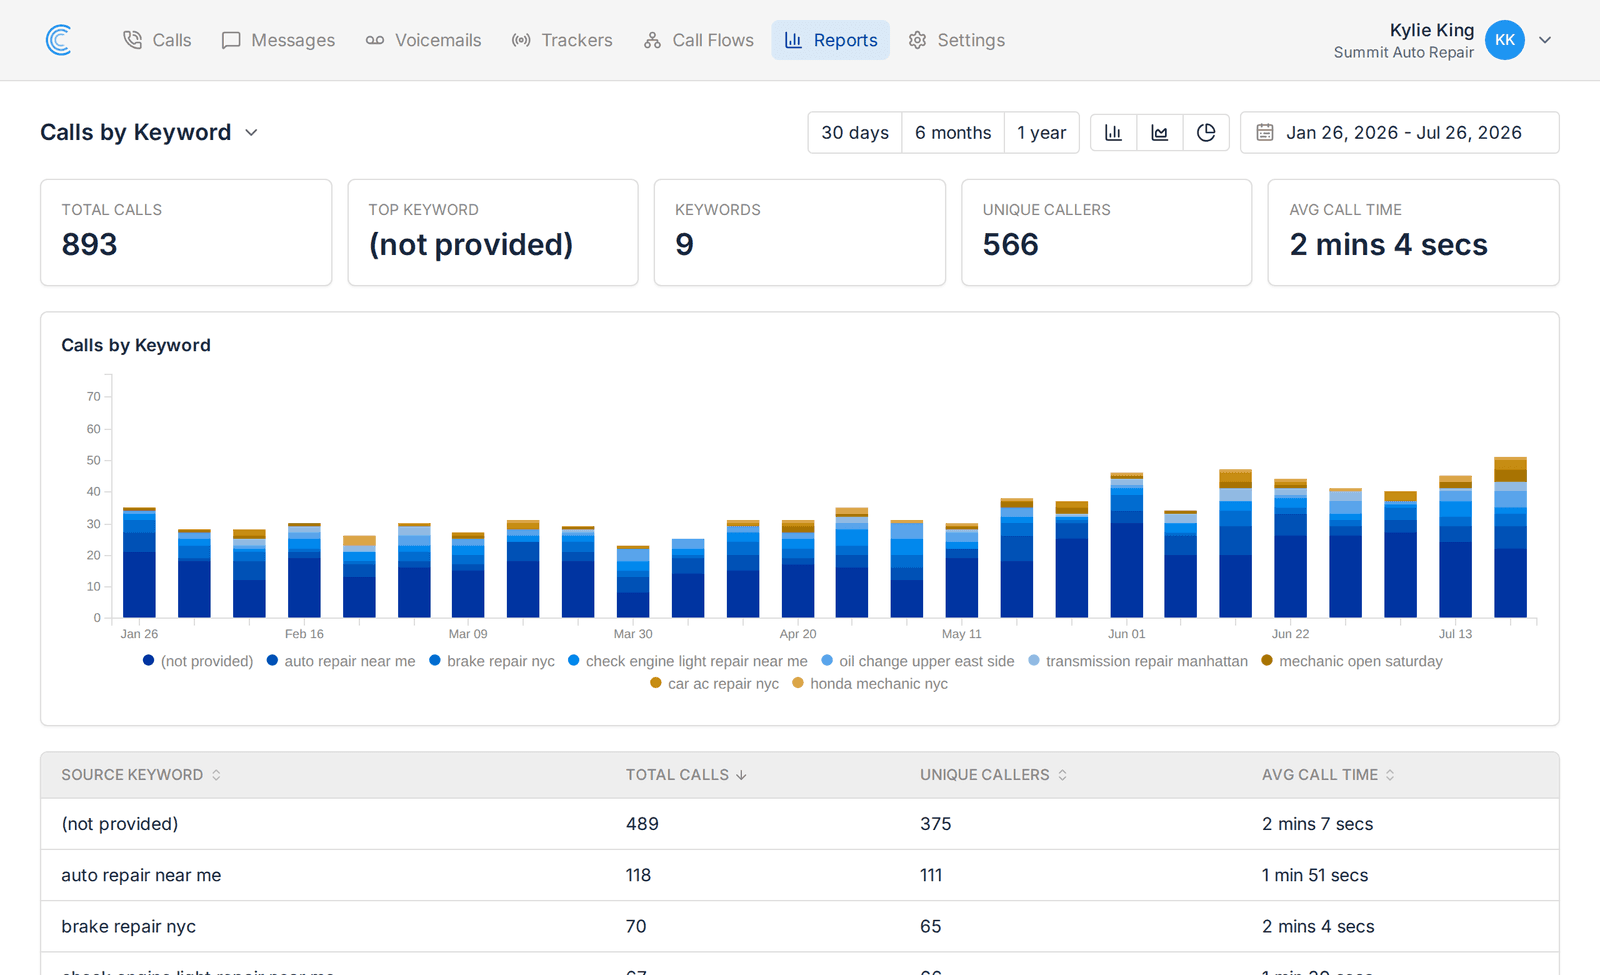
See the search terms that make your phone ring
Number Pool trackers tie each call to the keyword the caller searched. The report ranks every keyword by the calls it produced.
- Total calls, unique callers and average call time per keyword
- Your top keyword called out above the chart
- Daily call volume stacked by keyword
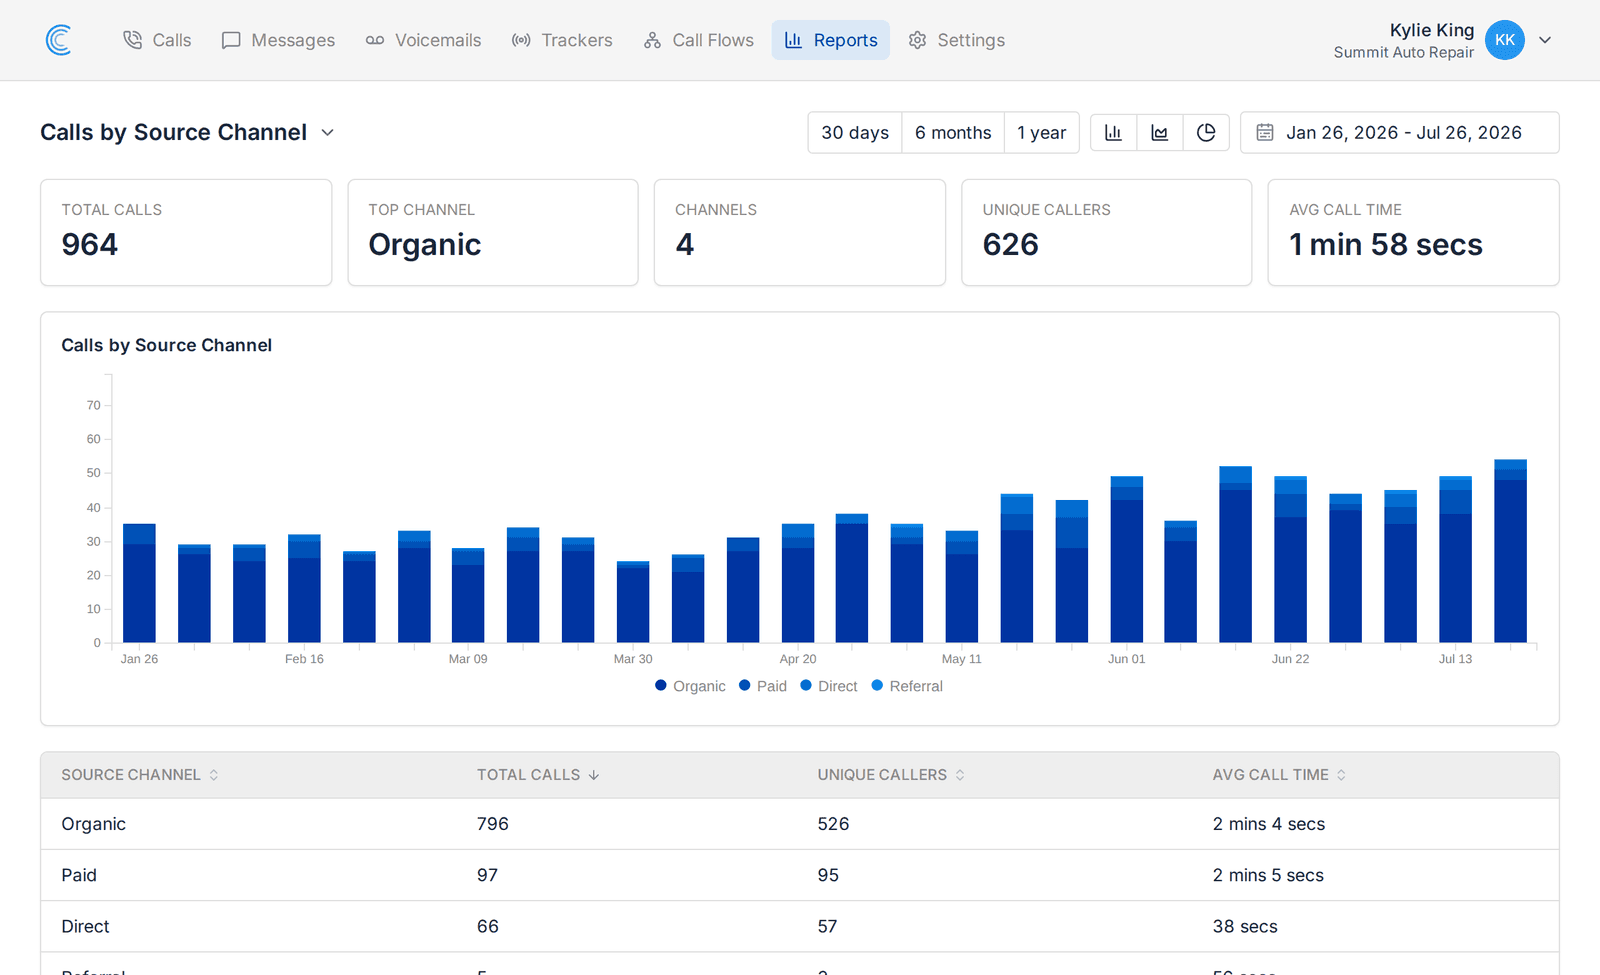
Compare calls from organic, paid, direct and referral traffic
Every call is grouped by the channel that brought the caller to you, so you can see which channels earn their budget.
- Your top channel called out above the chart
- Total calls and unique callers per channel
- Average call time per channel
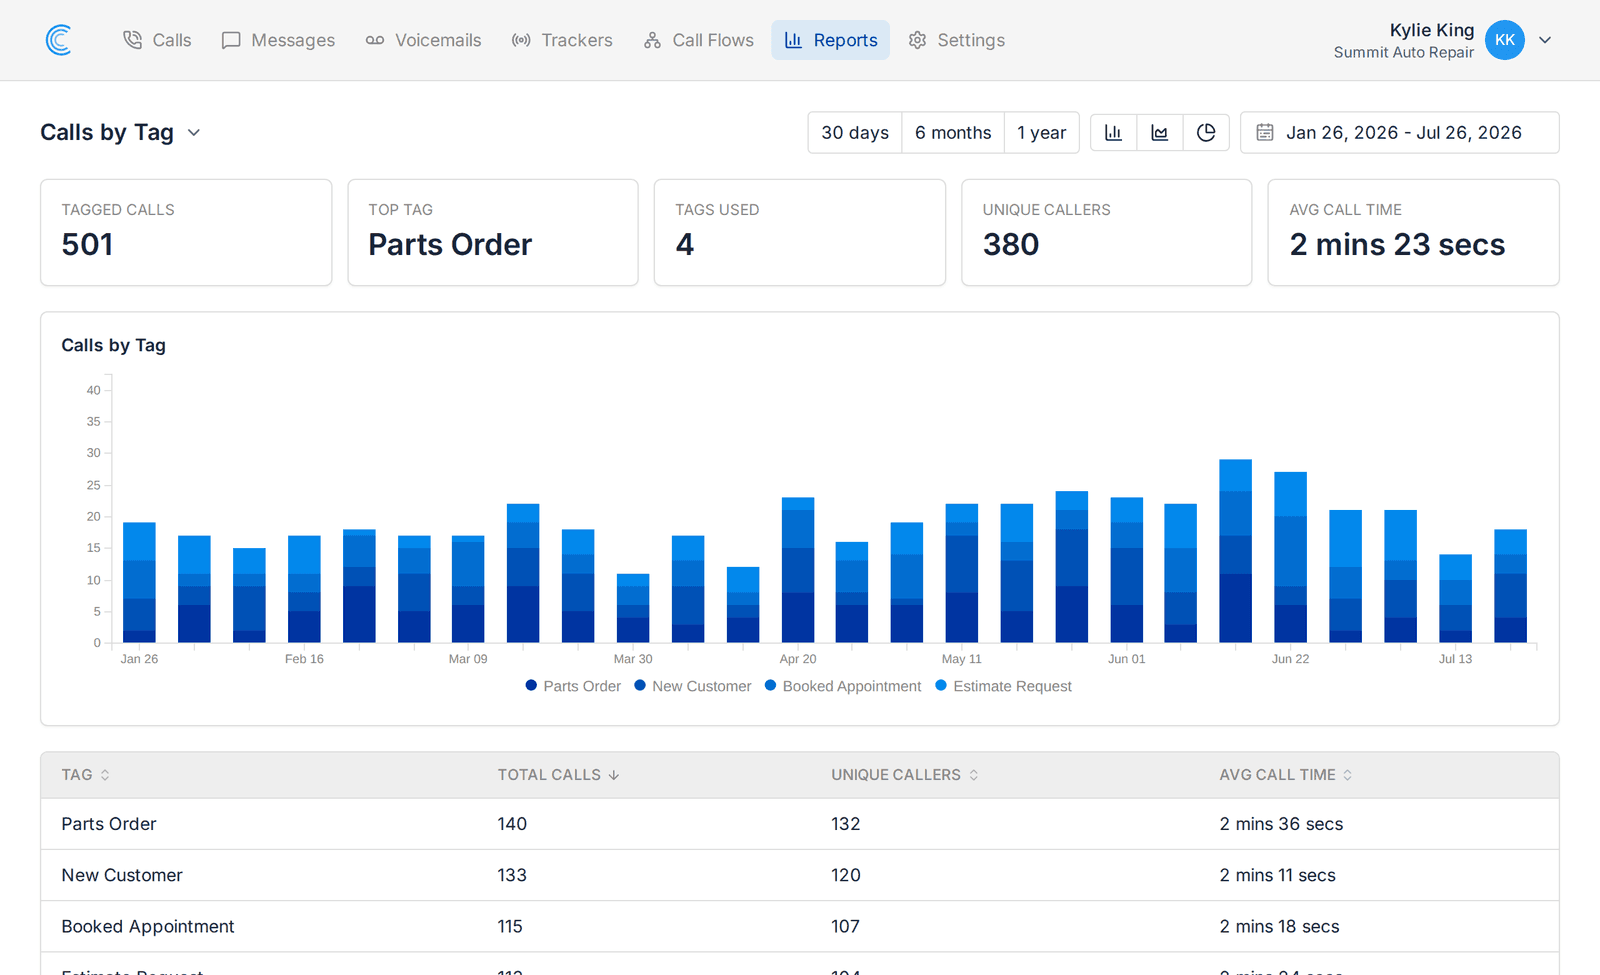
Track call outcomes with tags
Tag calls as you review them, with labels such as a booked appointment or a new customer. The report counts the calls behind each tag.
- Tagged calls and your top tag called out above the chart
- Total calls and unique callers per tag
- Daily call volume stacked by tag
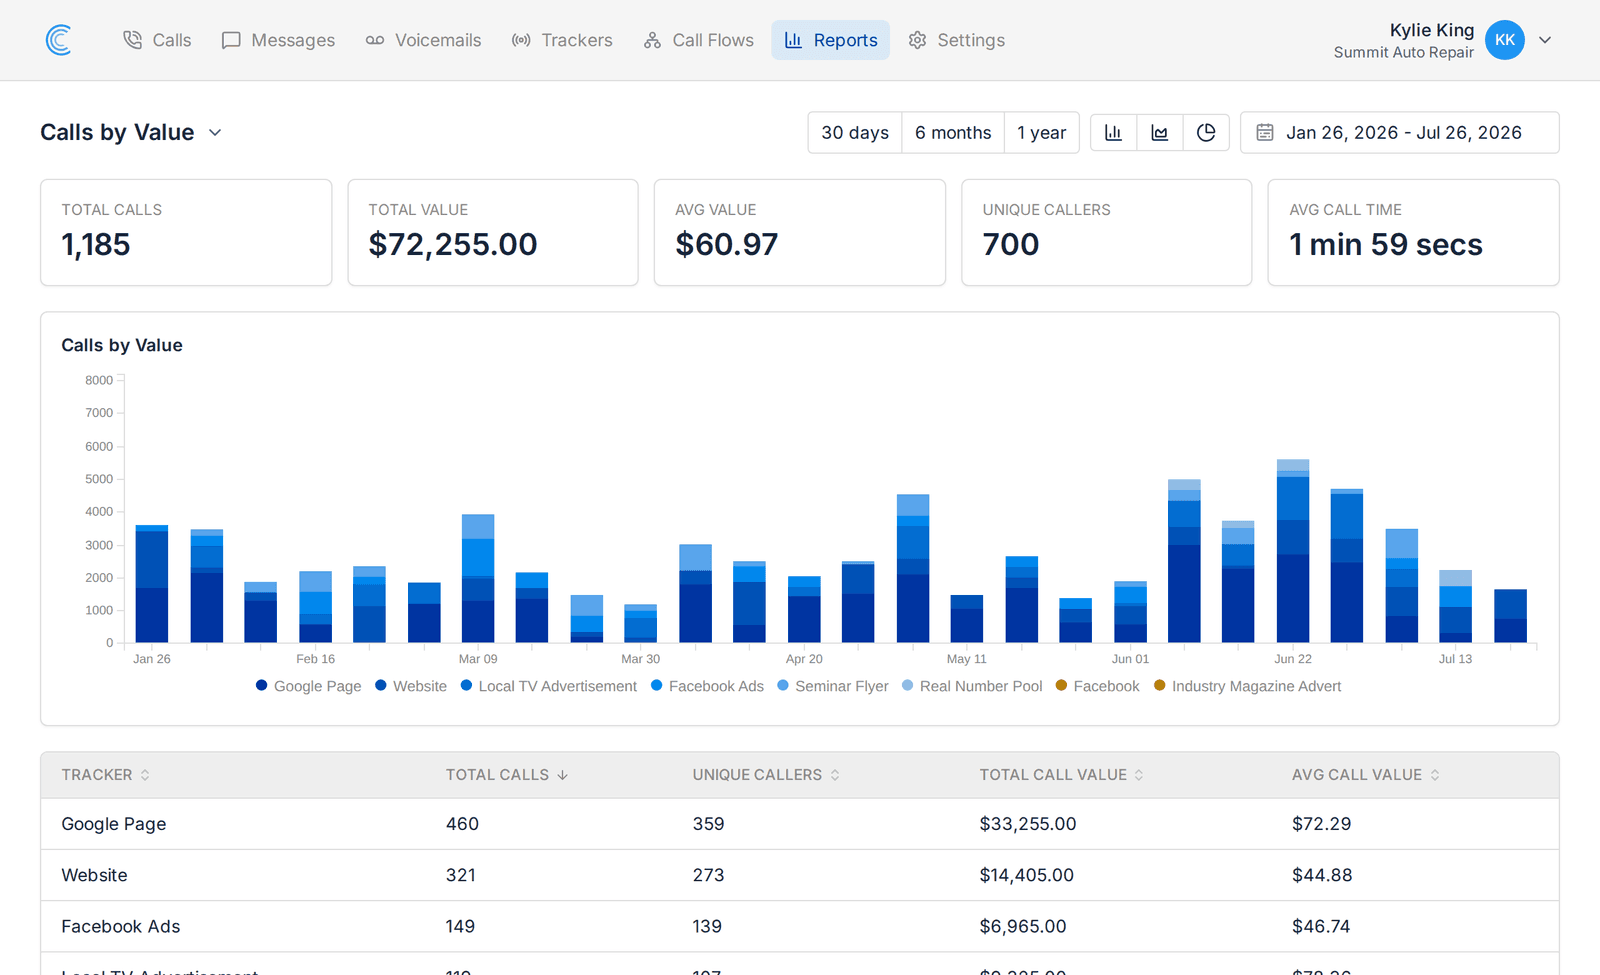
Connect call volume to revenue
Put a dollar value on answered calls. The report adds up what each tracker brought in.
- Total value and average value across all calls
- Total call value per tracker
- Average call value per tracker
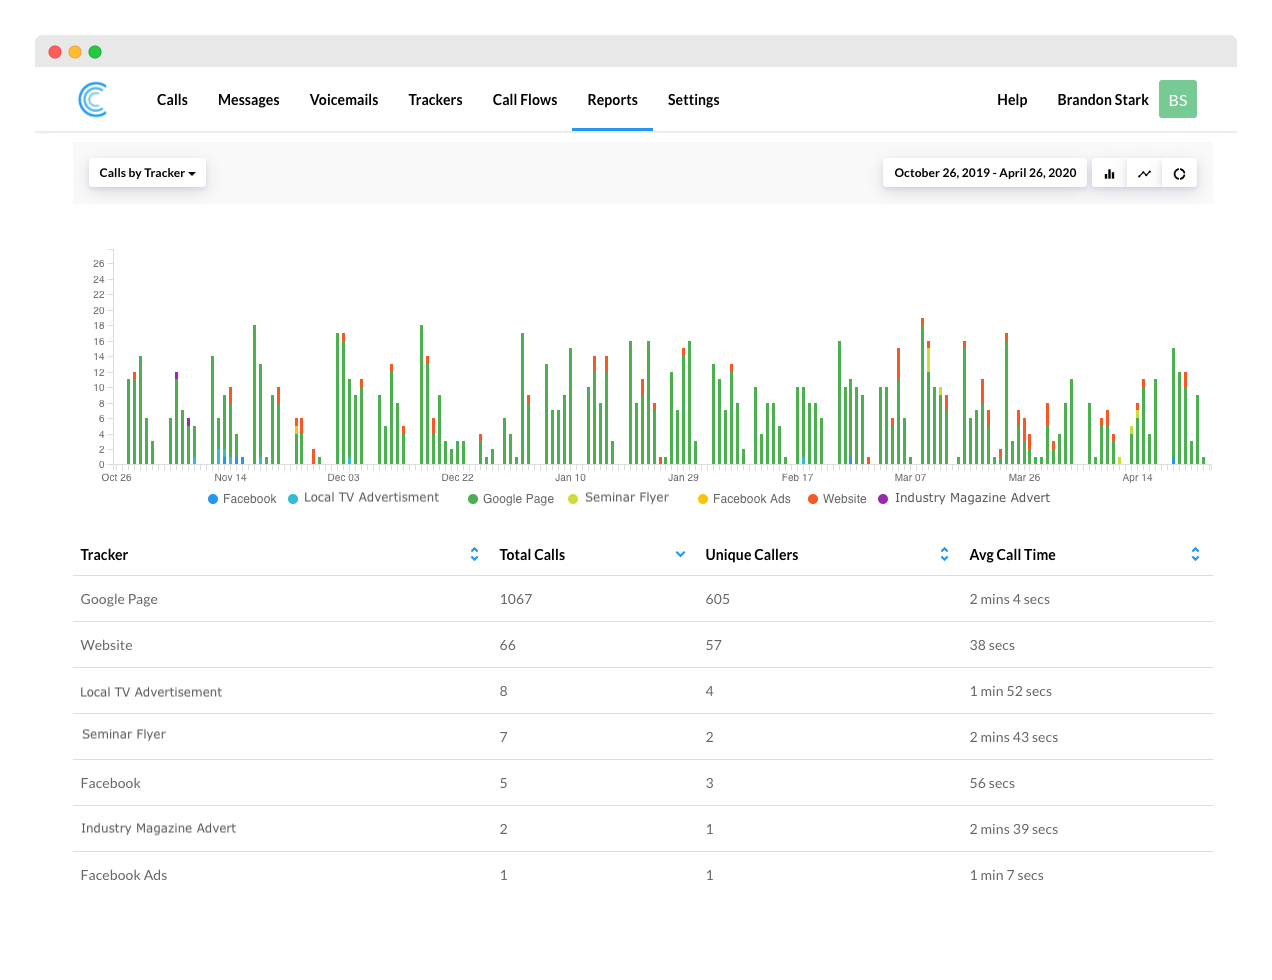
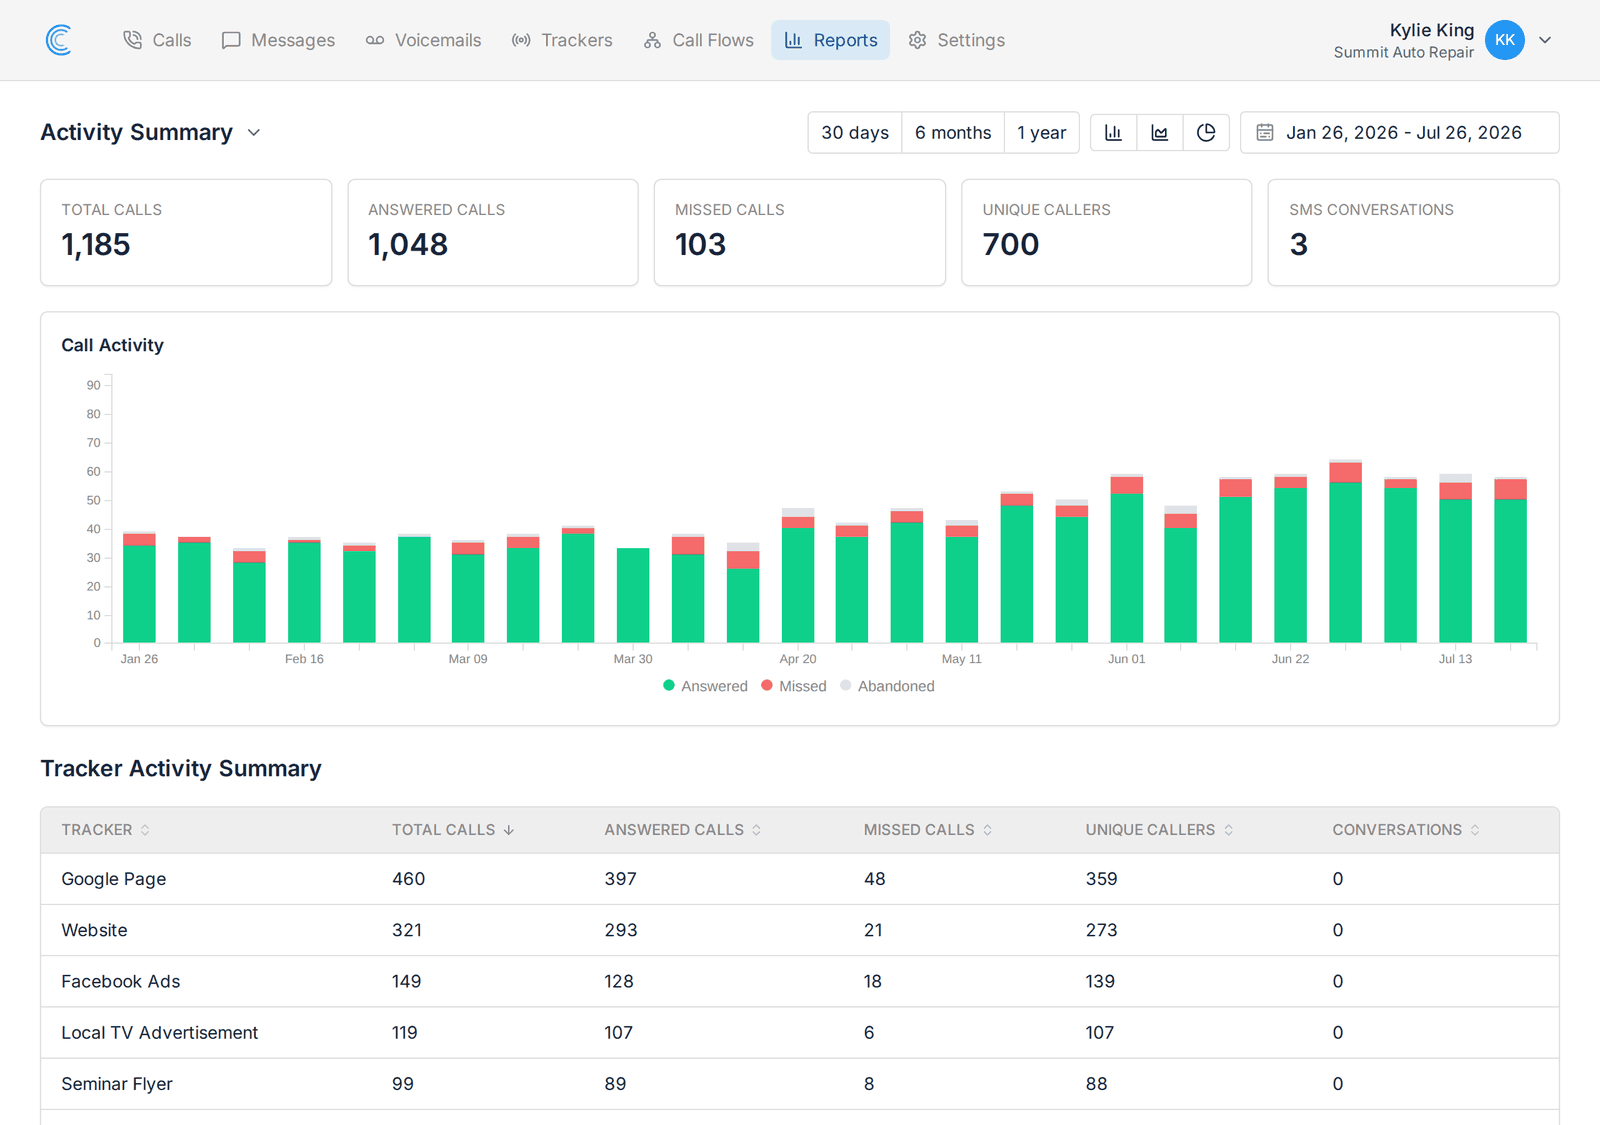
Compare every campaign side by side
Each tracker is one campaign or number pool. The report ranks them by the calls they produced, so the strong ones and the weak ones are obvious.
- Total, answered and missed calls across all trackers
- Daily call volume stacked by tracker
- Total calls, unique callers and average call time per tracker
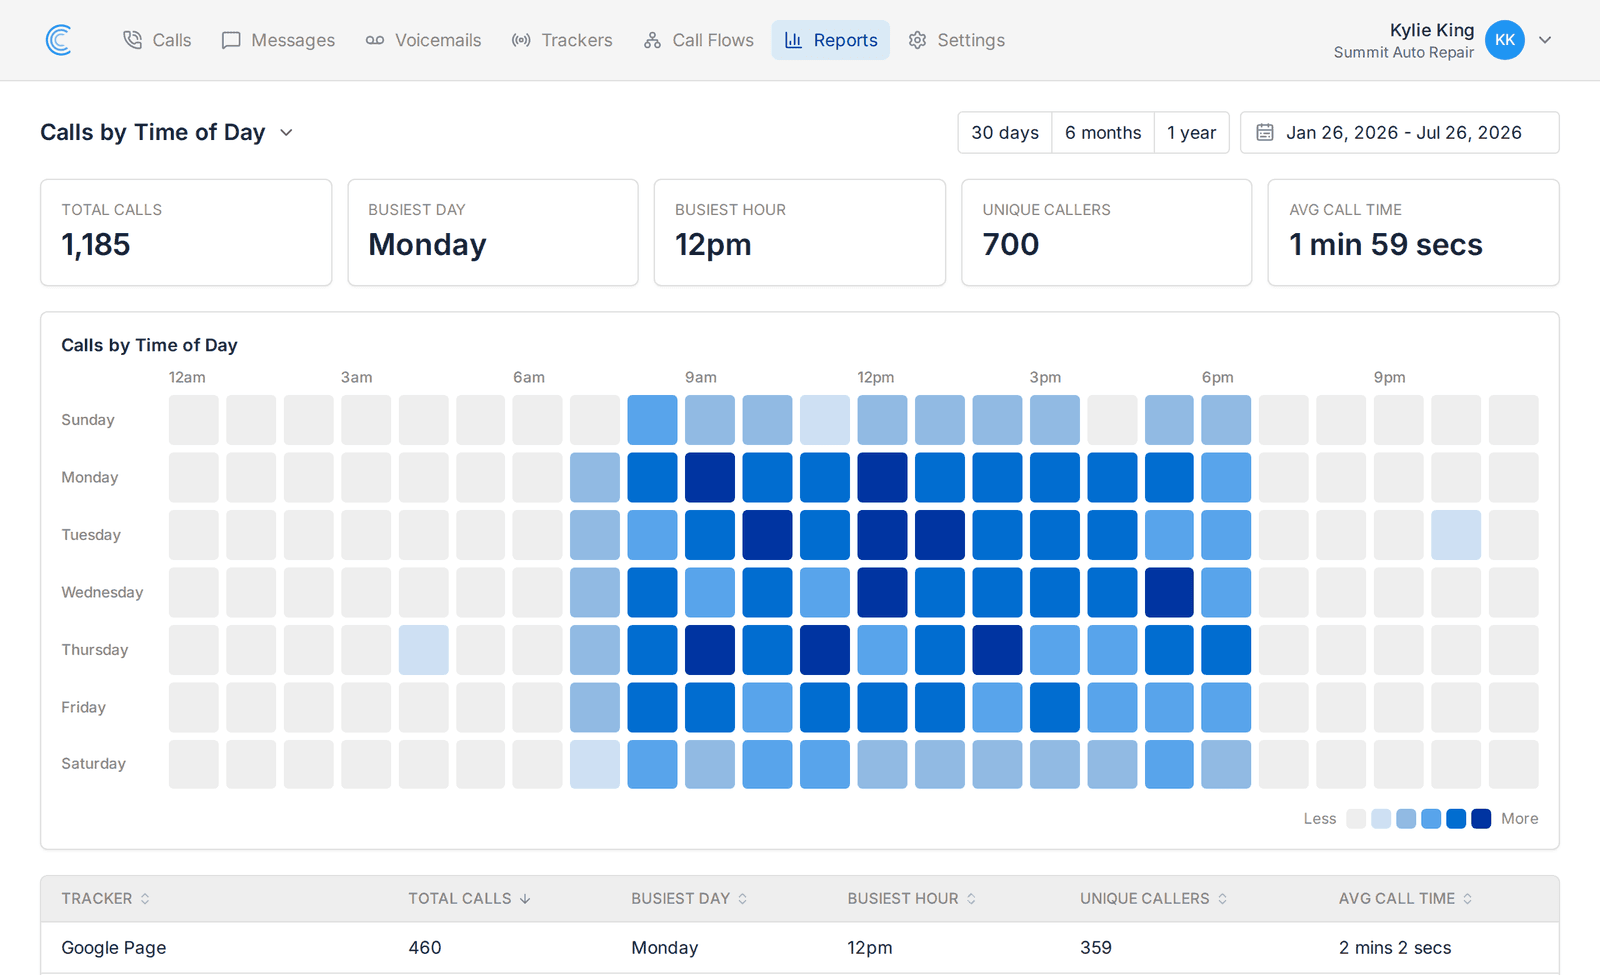
Find the hours your phone rings most
A weekday by hour grid of call volume shows when demand peaks, so you can staff the phones and schedule ads around it.
- Busiest day and busiest hour called out
- A heatmap of calls for every hour of the week
- Busiest day and hour for each tracker
Call data you can act on the moment it arrives
Real-time data
React the same day. Call data appears while the campaign is still running.
Full call history
Compare this month with last year. All of your call history stays available.
Multiple chart types
Switch chart types to see the data the way your team reads it best.
Keyword-level tracking
Number Pool trackers tie each call to the search keyword behind it.
Source channels
See which sources are converting and which are underperforming.
Call data exports
Build your own reports. Export call data and work on it in Excel.
Running Reporting is very easy. I am able to get the information I need easily.
Get more from every call you track
Dynamic Number Insertion
Match every call to the website visit, source and keyword behind it.
Summary Reports
Get the numbers by email each day, week or month, without logging in.
AI Transcriptions
Read any recorded call as speaker-by-speaker text, without replaying it.
Call Recording
Replay any call to hear how a lead from each campaign turned out.
What 500,000 tracked calls revealed
Our study of which marketing channels generate the most phone calls.
Reporting help docs
Step by step guides to reading and using every report in the app.